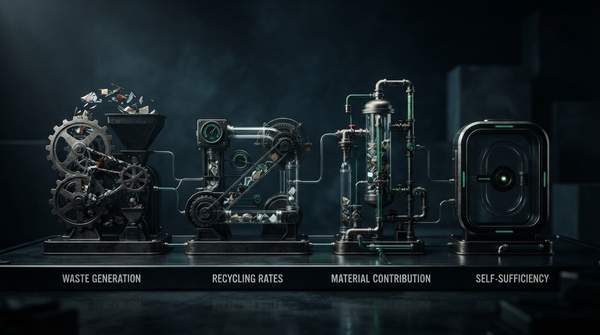
No single number tells you whether an economy is truly circular. The European Commission's monitoring framework acknowledges this by tracking ten indicators across the lifecycle of resources, products and services—and within that set, four metrics recur in policy analysis, investment screening and corporate reporting. Each answers a different question, draws on different data, and fails in a different way when used alone. Here is how to tell them apart and pick the right one.
Four Key EU Circularity Metrics and Their Scope
The four most consequential indicators in the Commission's framework are waste generation, overall recycling rates, the contribution of recycled materials to raw materials demand, and EU self-sufficiency for raw materials. As described in the Commission's indicator set, waste generation is expressed per capita or per unit of GDP; overall recycling rates are percentages applied to municipal waste; the recycled-materials contribution measures the share of secondary raw materials in total raw material demand; and self-sufficiency tracks the percentage of key materials used in the EU that are produced within the EU.
The distinctions matter more than they first appear. Two economies can report identical recycling rates while producing wildly different amounts of total waste. A country can be highly self-sufficient in raw materials while recycling almost nothing—or the reverse. These are not variations of one measurement; they are separate windows onto separate pressures, and the choice among them is the first analytical decision any evaluator makes, whether they realize it or not.